

The PxD matrix
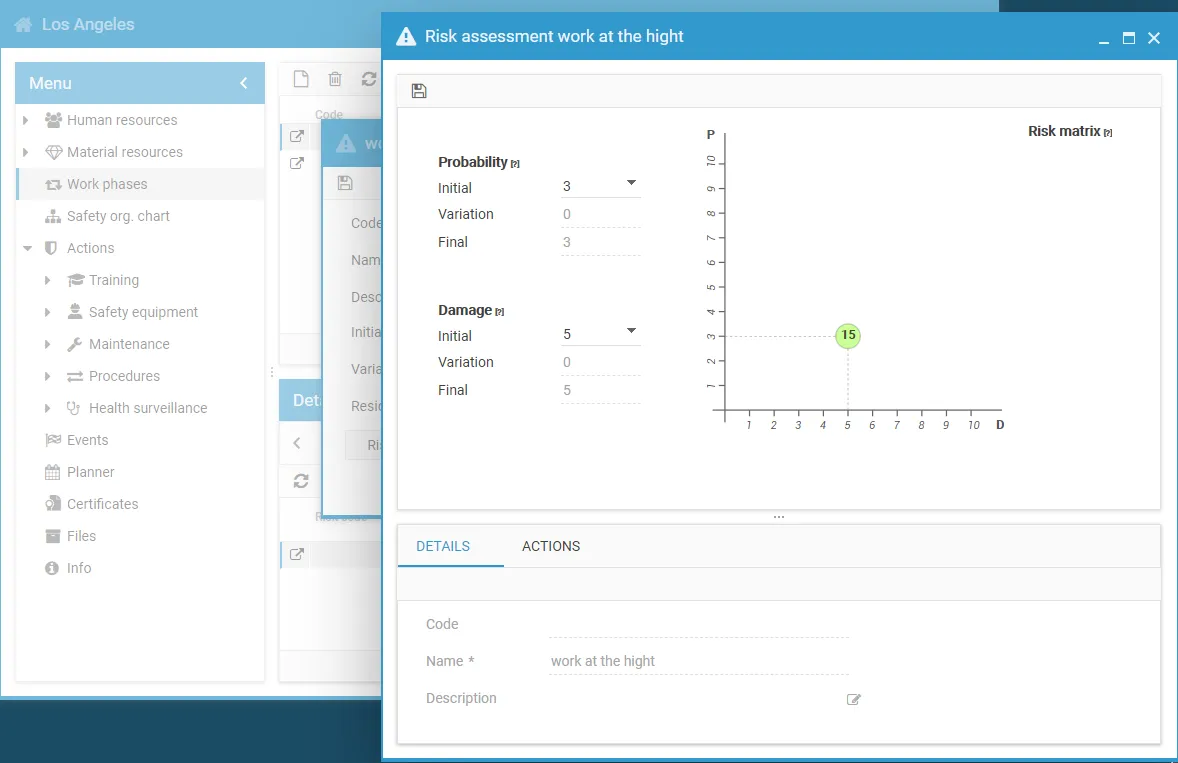
The matrix is a Cartesian grid:
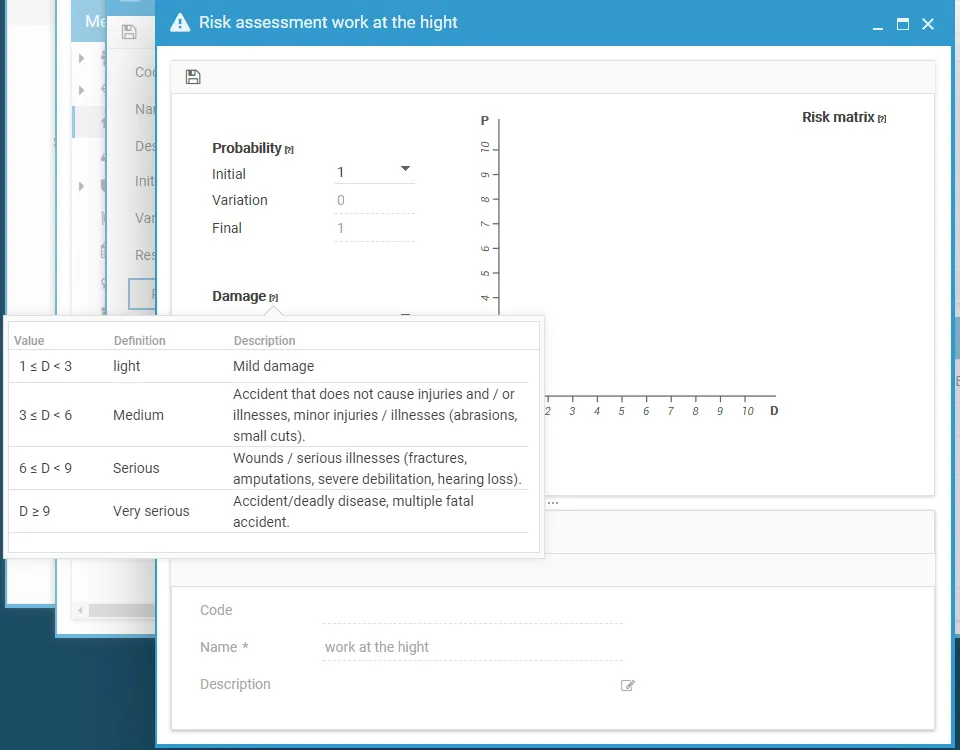
- Damage (D) on the X axis — how severe the consequences are if the event happens;
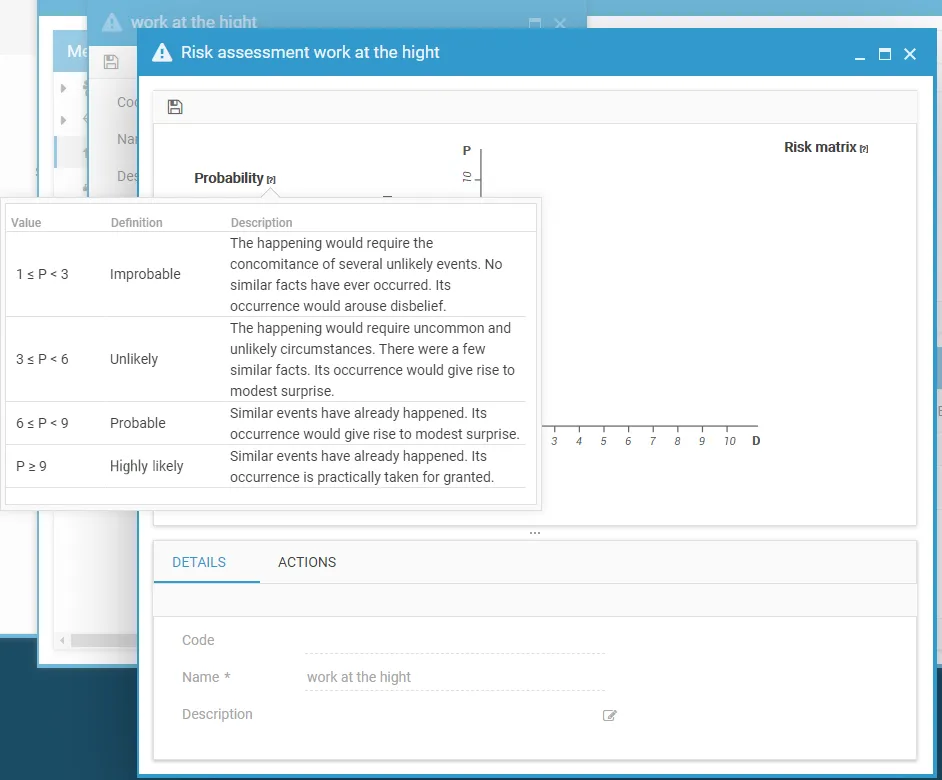
- Probability (P) on the Y axis — how likely the event is to happen.
The scales
Section titled “The scales”Both are rated from 1 to 9.
| Axis | From | To |
|---|---|---|
| Probability | Unlikely | Very likely |
| Damage | Minor | Very severe |
The colours
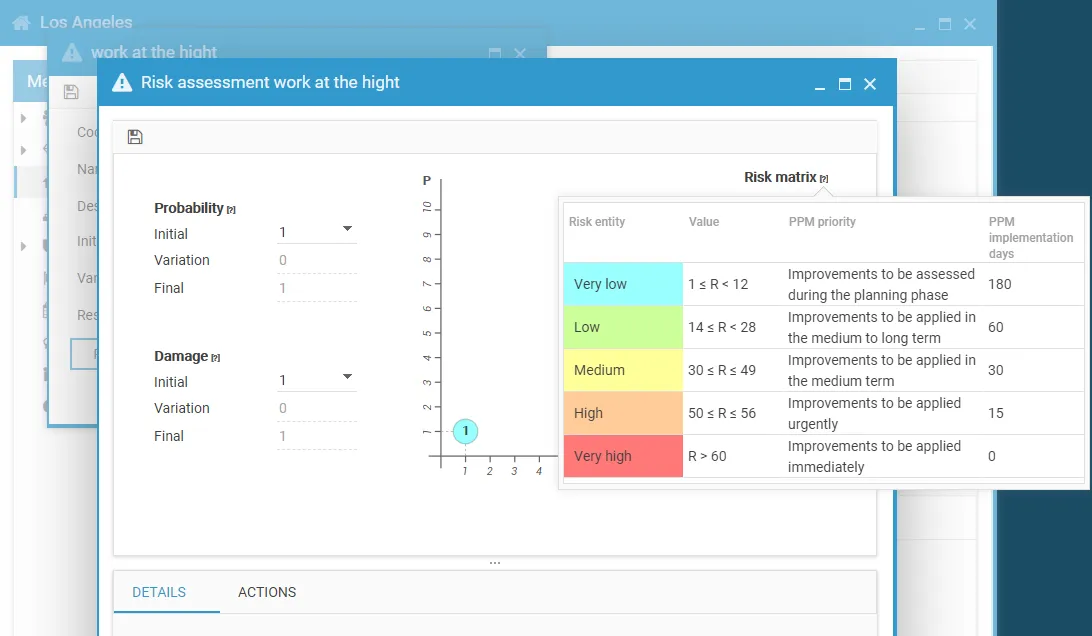
Section titled “The colours”Each risk value carries a colour, which indicates the severity and therefore the priority for action.
| Colour | Severity |
|---|---|
| Blue | very low |
| Green | low |
| Yellow | medium |
| Orange | high |
| Red | very high |
The full legend, with the corresponding values and intervention priorities, is available by hovering the question mark icon next to Risk matrix.
The three values in the risks list
Section titled “The three values in the risks list”| Value | Meaning |
|---|---|
| Initial risk | before the mitigation actions |
| Variation | the effect of the actions |
| Final risk | the residual risk, after the actions |
All three are 0 for a risk that has been entered but not assessed.
This site is protected by reCAPTCHA and the Google Privacy Policy and Terms of Service apply.